|
|
Post by Timm on Mar 30, 2015 21:12:19 GMT
Ok it's been a while since I've posted anything new. I really would like to hear some comments from you folks. I used my spectrometer again to measure the colored bands that appear in the cell from an edge-lit ring. This first pix has the reference colors and the points where they overlap: 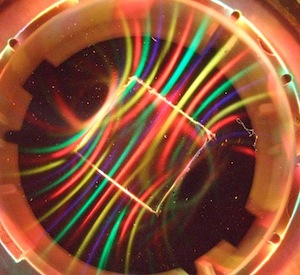 hi-res here: ferrocell.us/images/cube%20magnet%20edge-lit%20with%20blocking%20ring.JPGThe second group pix is the reference plots from each color (indicated at the top of each plot): 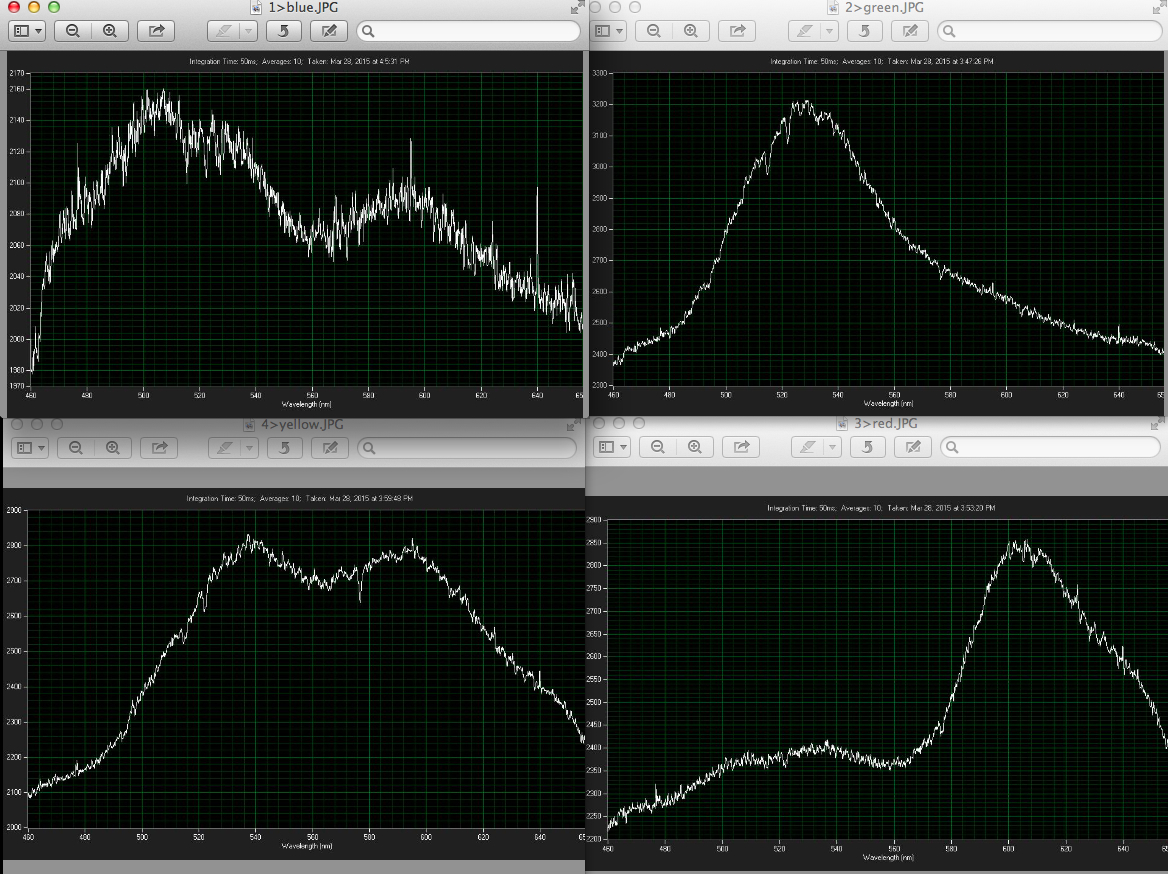 This third group of pix show how the colors actually "mix" to create a new color: 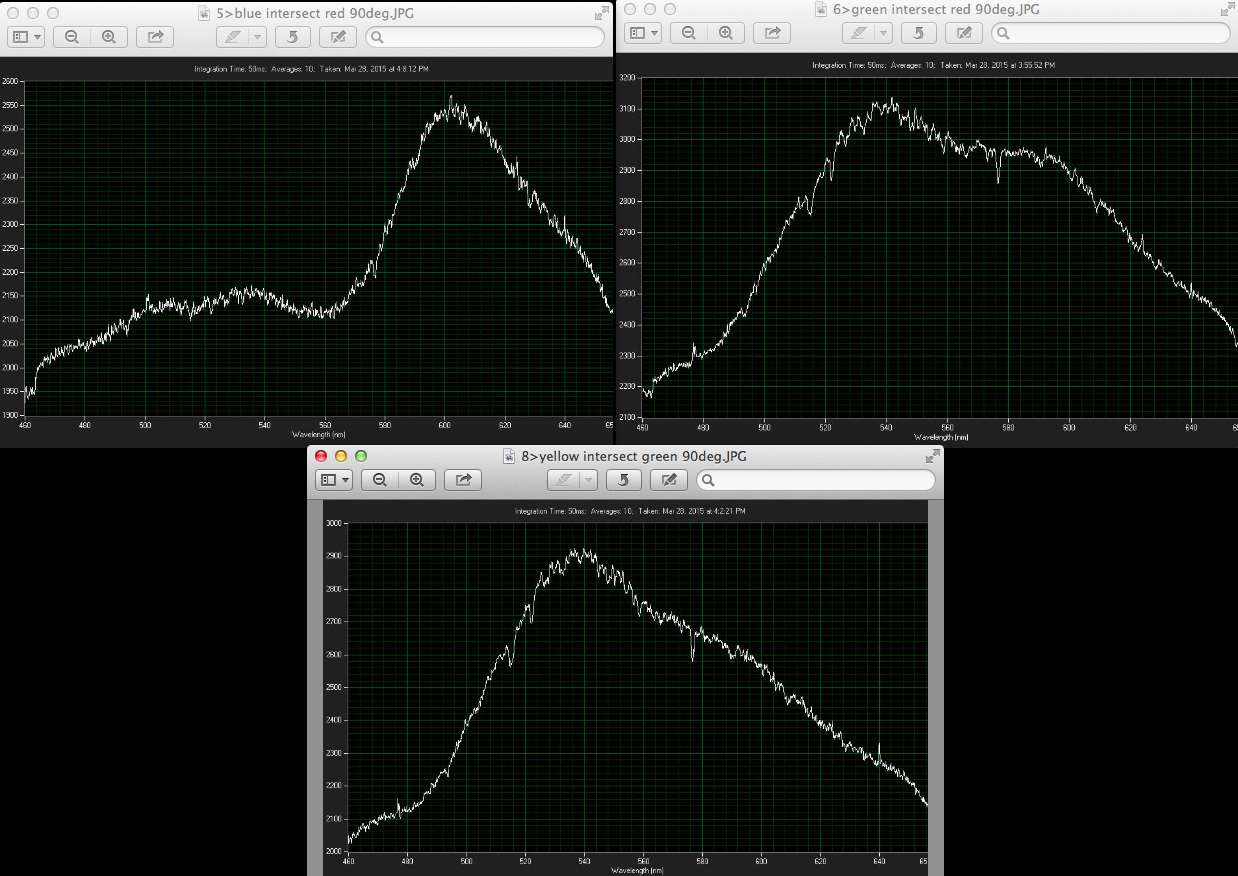 Just like mixing paint! This process could be used in optical computing if we assign each color and hue a numerical value. |
|

